Dont wan't to watch the video, read the text instead.
Investing in debt funds carries various types of risk. These risks include Credit risk, Interest rate risk, Inflation risk, reinvestment risk etc. But the key risks which needs be considered before investing in Debt funds are Credit Risk and Interest Rate Risk;
Credit Risk (Default Risk):
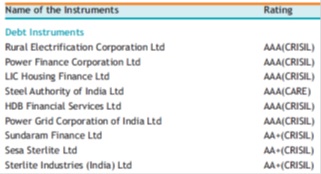
The chances that a borrower might not repay the interest or principle on the committed date is considered as credit risk or default risk. Credit risk is measured by “Credit ratings”. Credit rating agencies like CRISIL, ICRA, CARE etc. rate the issuer of the bond on their ability to repay by assessing their overall financial health.
Illustration: Ratings & the yield
| Ratings | Yield |
|---|---|
| Sovereign | 7.78% |
| AAA+ | 8.30% |
| AAA- | 8.90% |
Illustration: debt papers and their credit rating.

As credit risk increases, the expectation on return also goes up. If a specific debt fund claims to generate very high returns, the first thing that should be checked is the credit risk of the portfolio.
Credit rating can change over a period of time. The performance of companies is measured and the risk assessment is done at periodic intervals. The risk that a fund manager is worried about is not the risk of default but the possible downgrade in credit rating of the debt paper. If a debt paper gets downgraded, the market price of such instrument also comes down which affects the portfolio directly. On the other hand, if the credit rate gets upgraded the fund would be benefited by increase in its fund value.
Credit Spread:
The difference in the yield between 2 bonds with the same maturity is called the Credit Spread. As per the illustration given below, the credit spread between Sovereign bond (Govt Bond) and AAA rated bond is 52bps (basis points, 0.52%).
| Ratings | Yield |
|---|---|
| Sovereign | 7.78% |
| AAA+ | 8.30% |
| AAA- | 8.90% |
Interest rate risk
Market price of the bond and interest rates carry opposite relationship. Whenever interest rates in the market go up, the market prices of bond come down. Let’s understand this concept with an example:
- A bond presently available in the market carries a face value of Rs.100/- offers 8% coupon rate with the left over maturity of 3 years.
- The cash flow would be Rs. 8/- interest for next 3 years and Rs. 100/- principal repayment at the end of third year.
- The current interest rate offered in the market is 9%
- If the bond holder with 8% coupon rate decides to sell his bond, he might have to sell the bond at a discount on face value. The selling price of the bond would be around Rs. 97.47, which is lesser than the face value.
- Thus the thumb rule is “When the interest rate in the market rises, the market price of the bond comes down & vice-e-versa”
Measuring interest rate risk – “Modified Duration”:
Modified duration measures the price sensitivity of the bond for a given change in interest rate. In simple terms, if the interest rate changes ‘modified duration’ would tell us how much the price of the bond would change. By multiplying the change in interest with the modified duration, the change in the price of the bond/debt fund can be calculated.
Change in the price of the bond/debt fund = change in the interest rate X modified duration
Illustration: Impact on the price of the fund for a given change in interest rate
| Modified Duration | if the interest rate rise by 0.50%, price would go down by | if the interest rate goes down by -1.00%, price would rise by | |
|---|---|---|---|
| Income fund | 8.13 | 4.07% | -8.13% |
| Gilt Fund | 7.69 | 3.85% | -7.69% |
| Dynamic bond fund | 7.57 | 3.79% | -7.57% |
| Medium term opportunities fund | 3.36 | 1.68% | -3.36% |
| Short term fund | 1.53 | 0.77% | -1.53% |
| Liquid | 0.07 | 0.04% | -0.07% |
If the duration of the fund is high, the volatility of the fund is considered to be high. Gilt Funds & Bond/Income Funds are considered to be carrying higher interest rate risk in the debt fund family.
Weighted Average Maturity of the portfolio:
A portfolio of the debt mutual fund consists of various debt instruments maturing at different point of time. By looking at the weighted average maturity of the portfolio one can identify whether the fund has invested in short, medium or long term debt papers.Why weighted average, Why not average?
Why weighted average, Why not average?
If the portfolio of a debt fund consists of instruments with 3yrs, 5yrs, 7yrs and 10yrs to maturity, to arrive at average maturity, add these four numbers (3+5+7+10 = 25) and divide the same by four. So the average maturity of the portfolio would be 6.25 years. This may not be right way of communicating the maturity because the investments into each of these papers may not be equal.
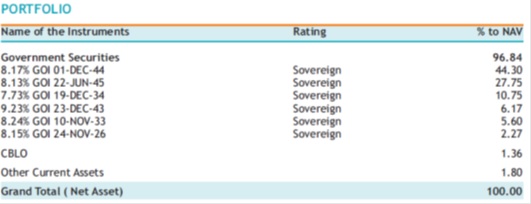
Illustration: Government securities with different maturities and weightages.

In such case, the right way is to use weighted average maturity. First step is to multiply the percentage of holding/allocation of each security with years to maturity.
The total of all the weighted maturities would lead us to Weighted Average Maturity of the portfolio.
| Date of Maturity | Years to Maturity | % of Allocation | Weighted maturity |
|---|---|---|---|
| 1-Dec-44 | 28.86 | 44.30% | 12.79 |
| 22-Jun-45 | 29.42 | 27.75% | 8.16 |
| 19-Dec-34 | 18.90 | 10.75% | 2.03 |
| 23-Dec-43 | 27.92 | 6.17% | 1.72 |
| 10-Nov-33 | 17.79 | 5.60% | 1.00 |
| 24-Nov-26 | 10.83 | 5.43% | 0.59 |
| Weighted average maturity of portfolio: | 26.29 | ||
Higher the Weighted average maturity, longer the term papers of the portfolio and hence higher duration. High duration in a fund means higher volatility and vice-e-versa.
The weighted average maturity is not a constant factor in debt fund portfolio. As the inflationary, interest rate and macro-economic scenarios keep changing, fund managers would keep changing the type of debt instruments in the portfolio. With the change in debt papers, even the maturity of the papers keeps changing.
Following weighted average maturity of the fund portfolio on a monthly basis would give an idea on the fund house view on interest rates.
Illustration: The weighted average maturity of a debt fund portfolio over 3 months.
| June | July | Aug | |
|---|---|---|---|
| Yield to Maturity (YTM) | 7.84% | 9.71% | 9.36% |
| Modified Duration | 5.17 Years | 2.60 Years | 6.20 Years |
| Average maturity | 7.91 Years | 4.29 Years | 12.44 Years |
As per the mentioned illustration, fund manager was expecting a rate hike in the month of June that is why he had sold long term holdings and had reduced weighted average maturity of the portfolio from 7.91 to 4.29 years.
Correspondingly even modified duration of the fund has reduced. So during this interest rate hike, the impact on the fund would have been much lesser because Modified duration has been reduced from 5.17 to 2.60 years. As the modified duration reduces, the volatility of the fund reduces. The fund manager’s assessment on the interest rate was also right in the month of July.
- The above table is for illustration purpose only & shall not be construed as indicative yields/returns of any of the Schemes of Canara Robeco Mutual Fund. Past performance may or may not be sustained in the future.


